Warehouse reports
Introduction
The ERP FOSS trade automation platform can generate various warehouse accounting reports. This article covers the most popular warehouse reports used by our customers:
Stock balances on a date
Inventory valuation
Product turnover
Product report
To work with these reports, go to the "Warehouse" module.
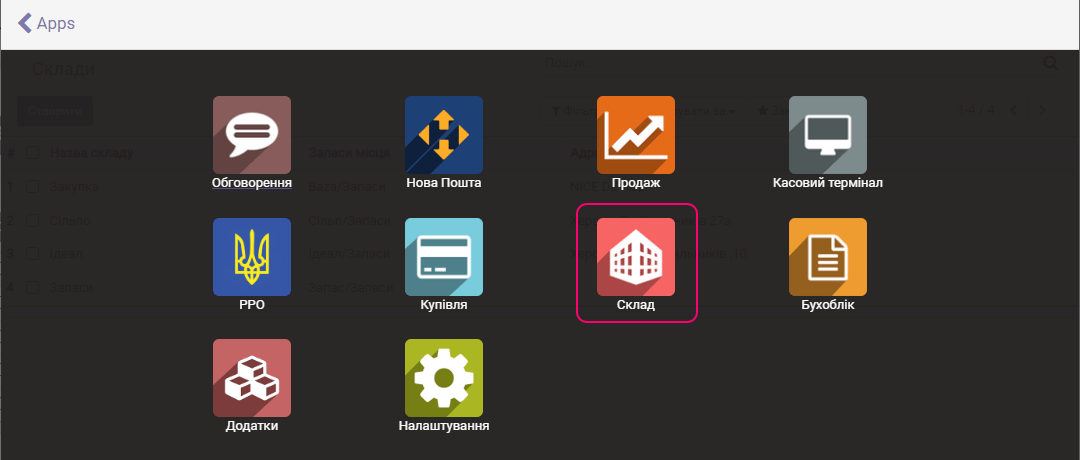
Let us go through these warehouse reports one by one.
Stock balances on a date
The "Stock balances on a date" report shows the quantity of products and their purchase value. You can build this report for a specific date in the past (usually the current date) and for a specific warehouse (usually it is built for all warehouses). Stock is shown by internal product categories, if you use them (there is usually a category called All).
To generate the report, select the menu item Reports/Stock balances on a date. The settings form appears:
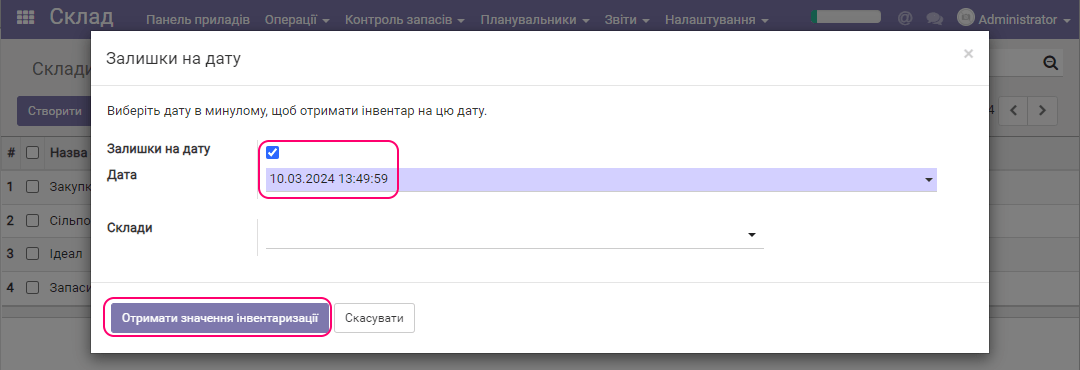
Click Get inventory values. An empty report is displayed. To see the data, remove the Empty filter:

After you remove this filter, the generated report opens:
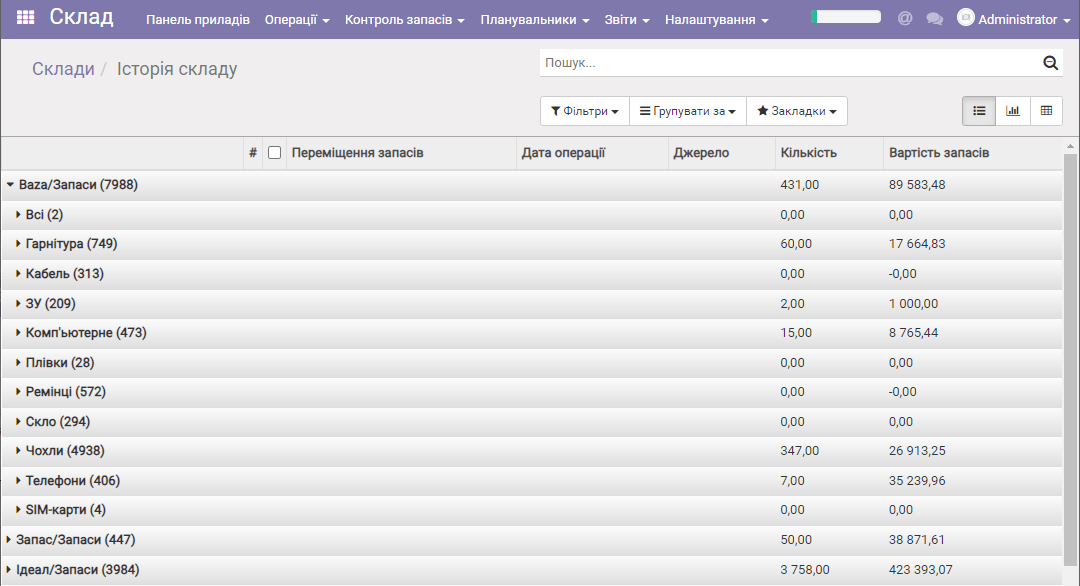
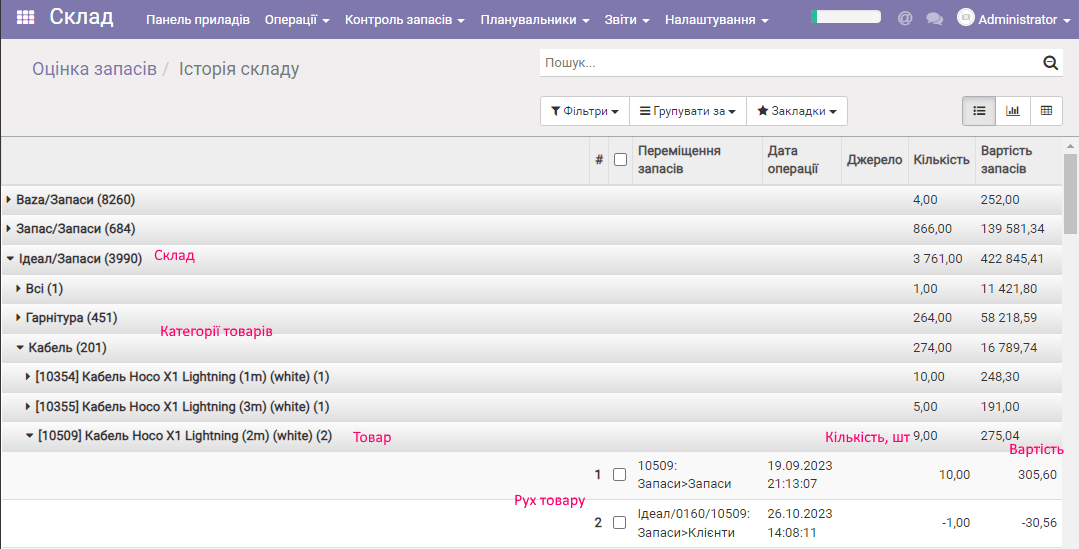
The left column of the report lists the warehouses; on the right are the total quantity of products (units) in them and their total cost price. You can drill down this report by categories and then by the products themselves. The report also shows product movements in the warehouse:
Inventory valuation
This report is similar to the previous one, but it is built for the current date and for all warehouses that have non-zero product balances. To generate it, select Reports/Inventory valuation. An empty report is displayed:

You can apply additional filters to it. To see the data, remove the Empty filter:
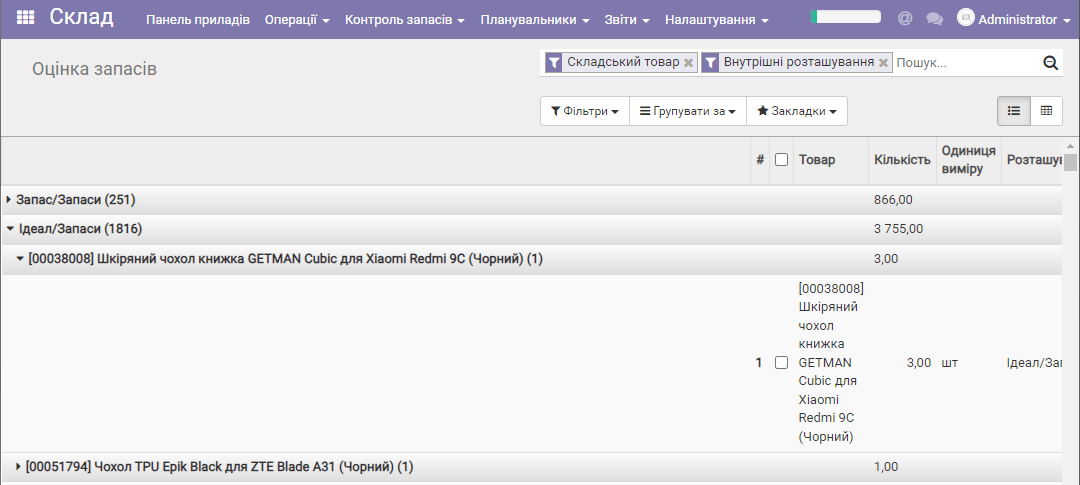
The left column of the report lists the warehouses; on the right is the total quantity of products (units) in them. You can drill down this report by categories and then by the products themselves. The report also shows product movements in the warehouse.
Product turnover
This report is a powerful tool for controlling product movements in all possible directions (sales, purchases, internal transfers). To open this report, select the menu item Reports/Product turnover.
You must select the warehouses for which the report is built and the date range. You can select the Group by category checkbox to generate the report not for individual products but for their groups (categories). Then click Apply:
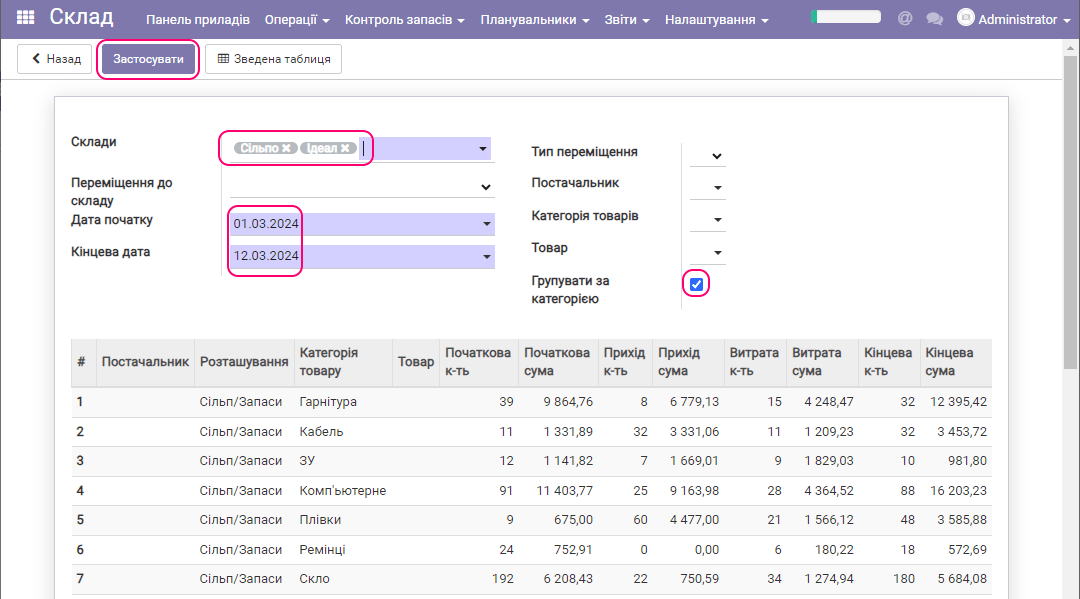
From this report you can see how many products you had in these warehouses at the start and at the end of the selected period, and the difference in quantity and in money.
This difference can be caused by various operations with products (movements). You can select which movement you are interested in:
Sales at the cash register;
Sales by invoices;
Purchases;
Purchases with sales;
Internal transfers;
Inventory counts,
and display the report for the selected movement, that is, track how the selected movement affected the quantity of the selected product.
You can build the report for an individual product supplier, a product category or a specific product.
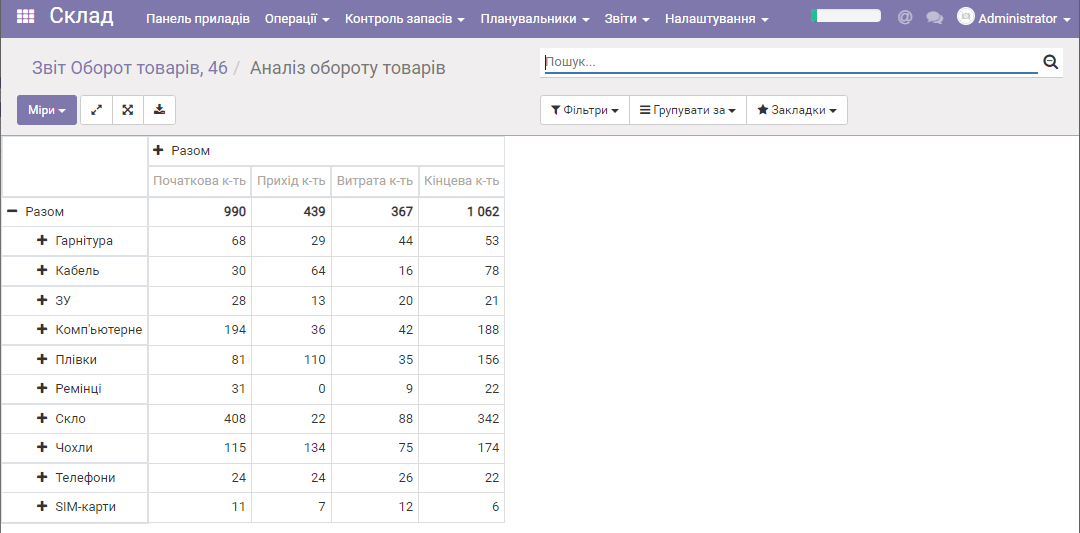
The Pivot table button converts the report into a table form, which you can then export to an Excel file:
Product report
This warehouse report provides information about the products in stock in the warehouses, with the option to group, filter and sort them by various criteria. You can also create internal transfers from one warehouse to another from this report.
To generate it, select Reports/Product report. The settings form appears:
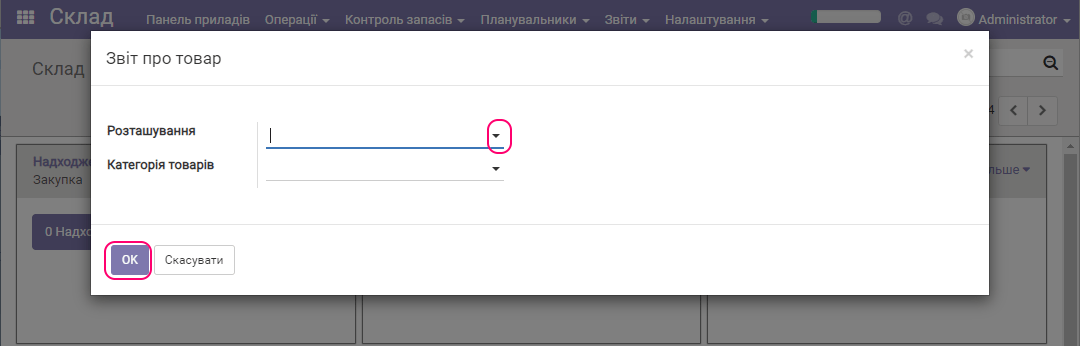
Here you can select a specific warehouse for the products it contains and/or specific product categories to analyze. You can leave these fields empty, and then the data for all warehouses and product categories is displayed. Click OK. As an example, we get a report for all warehouses and one selected product category:
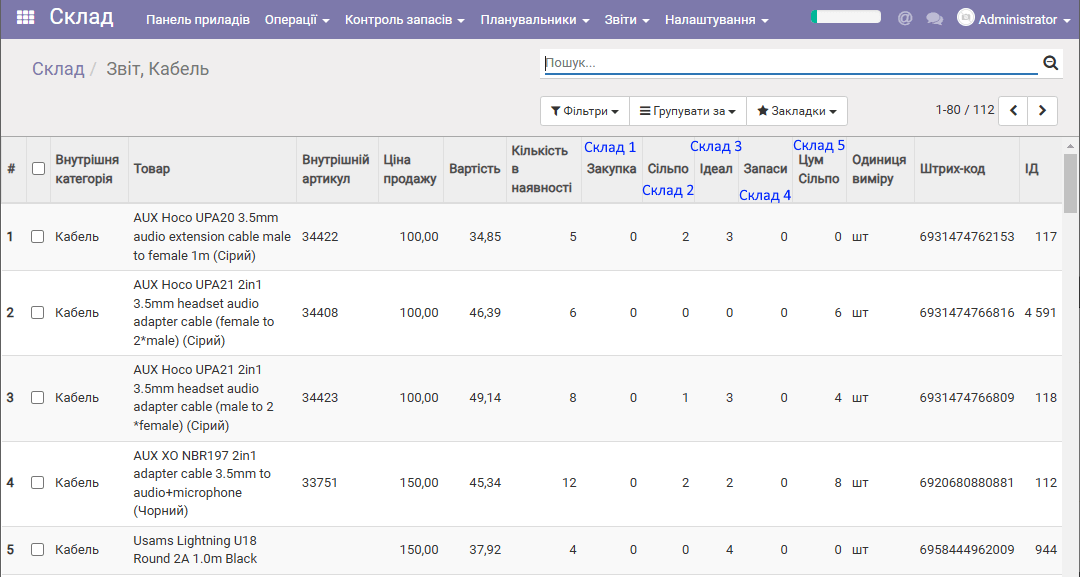
Unlike a simple table of the product database, this report shows the quantity of products in the warehouses and lets you sort products by any column of the table. In particular, you can sort products by quantity in stock to see depleted stock.
You can also group products by some criteria.
For example, we can create a filter by the quantity of products in warehouse2 (the warehouse number is just its sequence number in the report table).
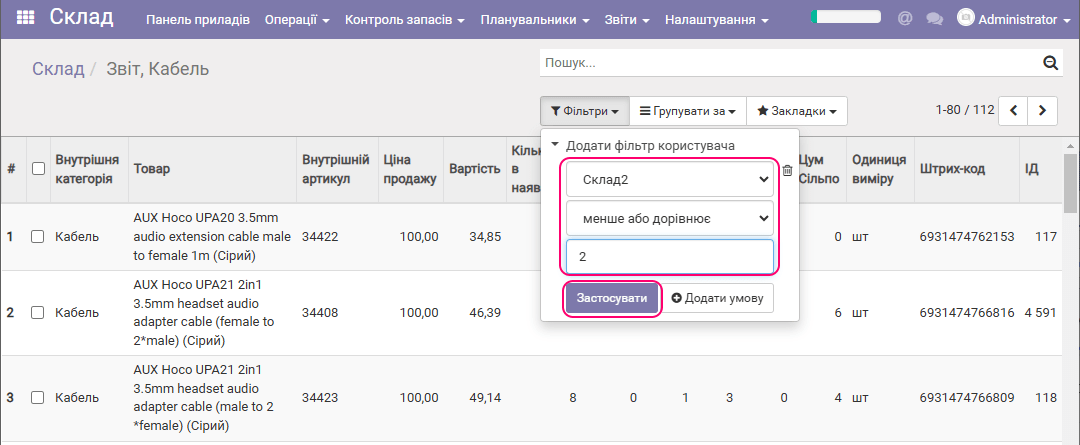
That is, in this filter we set the report to show all products that have from 0 to 2 units in warehouse2. Click Apply:
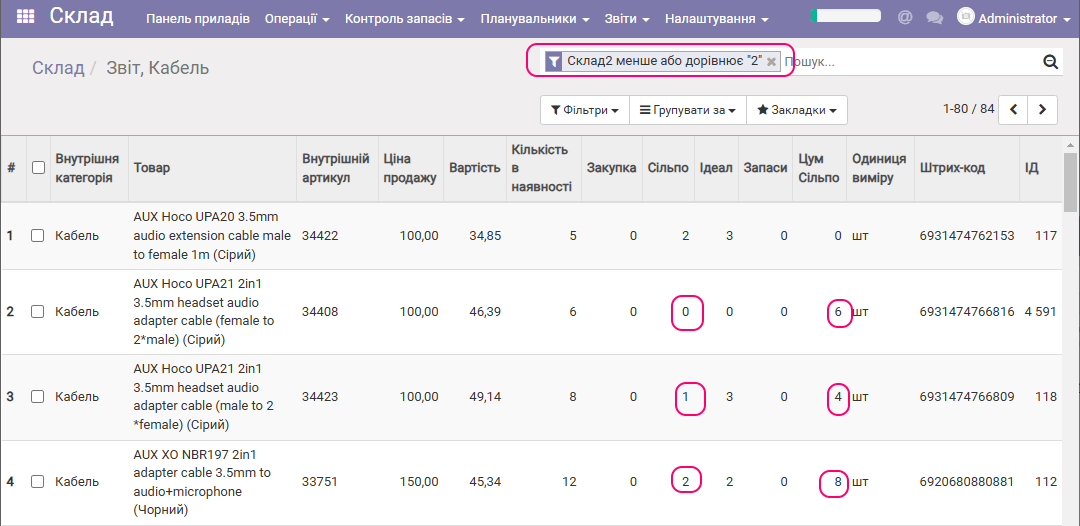
We get a filtered report. We analyze the stock balances in the warehouses and see, for example, that some warehouse has the products in sufficient quantity, while in the selected warehouse they are already depleted.
We can create an internal transfer of products from one warehouse to another directly from this report. To start, simply click the corresponding row of the report:
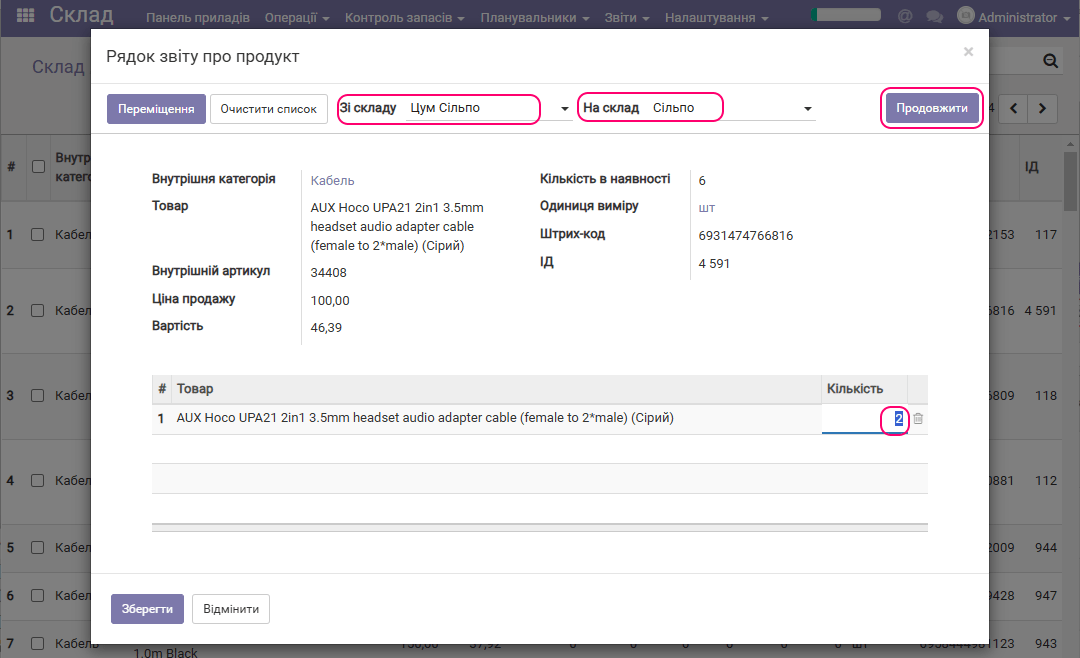
Then specify the warehouse the transfer is made from and the warehouse the products arrive in. Edit the quantity of products to transfer if needed (usually it is 1 pc). Click Continue to select other products.
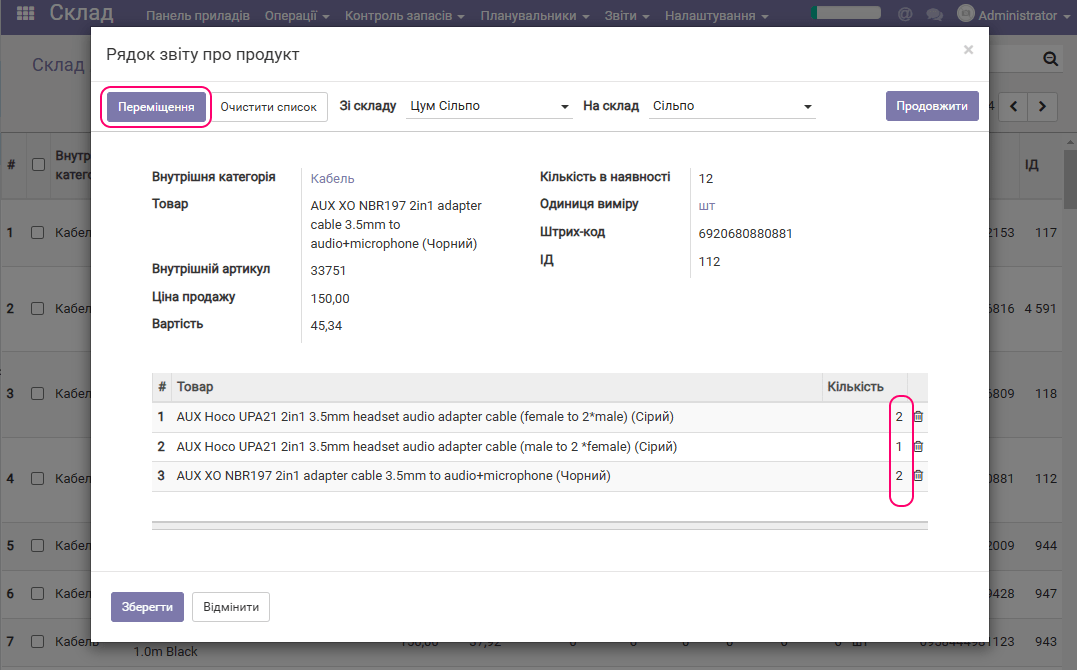
Suppose that at some point we have created the required list of products. Then click Transfer, and a draft internal transfer is created, which you can work with as usual.